
Description
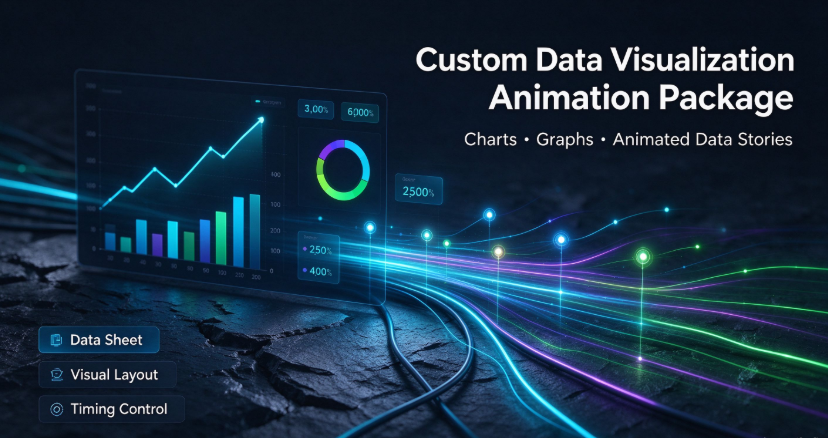
This package focuses on creating dynamic, chart-based animations that intuitively illustrate data trends and logical relationships. Deliverables include: high-definition MP4 video, project source files, an infographic PDF, and a spreadsheet containing the reference data.
Service Workflow: Organizing raw data and content outlines (0.5 days) → Designing visual layouts and storyboards (2 days) → Creating animated chart sequences (2 days) → Fine-tuning details and color adjustments (1 day) → Final rendering and packaging.
Estimated turnaround: 6 business days. All files will be uploaded to a cloud drive, with a download link provided. All graphic assets are original and free of copyright issues; no proprietary logos or trademarks are used. This service is ideal for reports, presentations, and online educational content, with the flexibility to update the underlying data in the source files later.